Article
Metrics & tracking
How to track a synergy: a five-stage walkthrough
Synergy tracking in practice: the cost of untracked assumptions.
Article
Metrics & tracking
Synergy tracking in practice: the cost of untracked assumptions.
October 1, 2026
•
3 minutes

Most guidance on synergy tracking tells you it matters (and maybe why it matters), but this one shows you how to do it. We're going to take a single line item—a fleet disposal worth an estimated $800,000—and follow it through five stages, from the first screening call to the year-three review. At each stage you'll see exactly what gets recorded, what changes, and what the number would have looked like if nobody had been watching. And if by the end, the line item is worth something different than expected, what do you do with that difference? Based on a value realization session with AP McColgan and Vil Audinis. Last updated: September 2026.
You run corporate development for a logistics business in the Boston area. Your mandate is straightforward: grow sales by $20 million over three years through acquisition, without leaving the region.
You've got a target in initial analysis, a regional carrier with a fleet, a depot, and a customer book. Everything below follows one line item on that deal. We're not talking about the whole thesis, or the integration plan as a whole, just one line. Stick with us.
That constraint is deliberate; teams that try to stand up synergy tracking across every assumption at once usually abandon the practice fairly early. But the right line item, tracked properly from end to end, can you more than a spreadsheet of forty you never update.
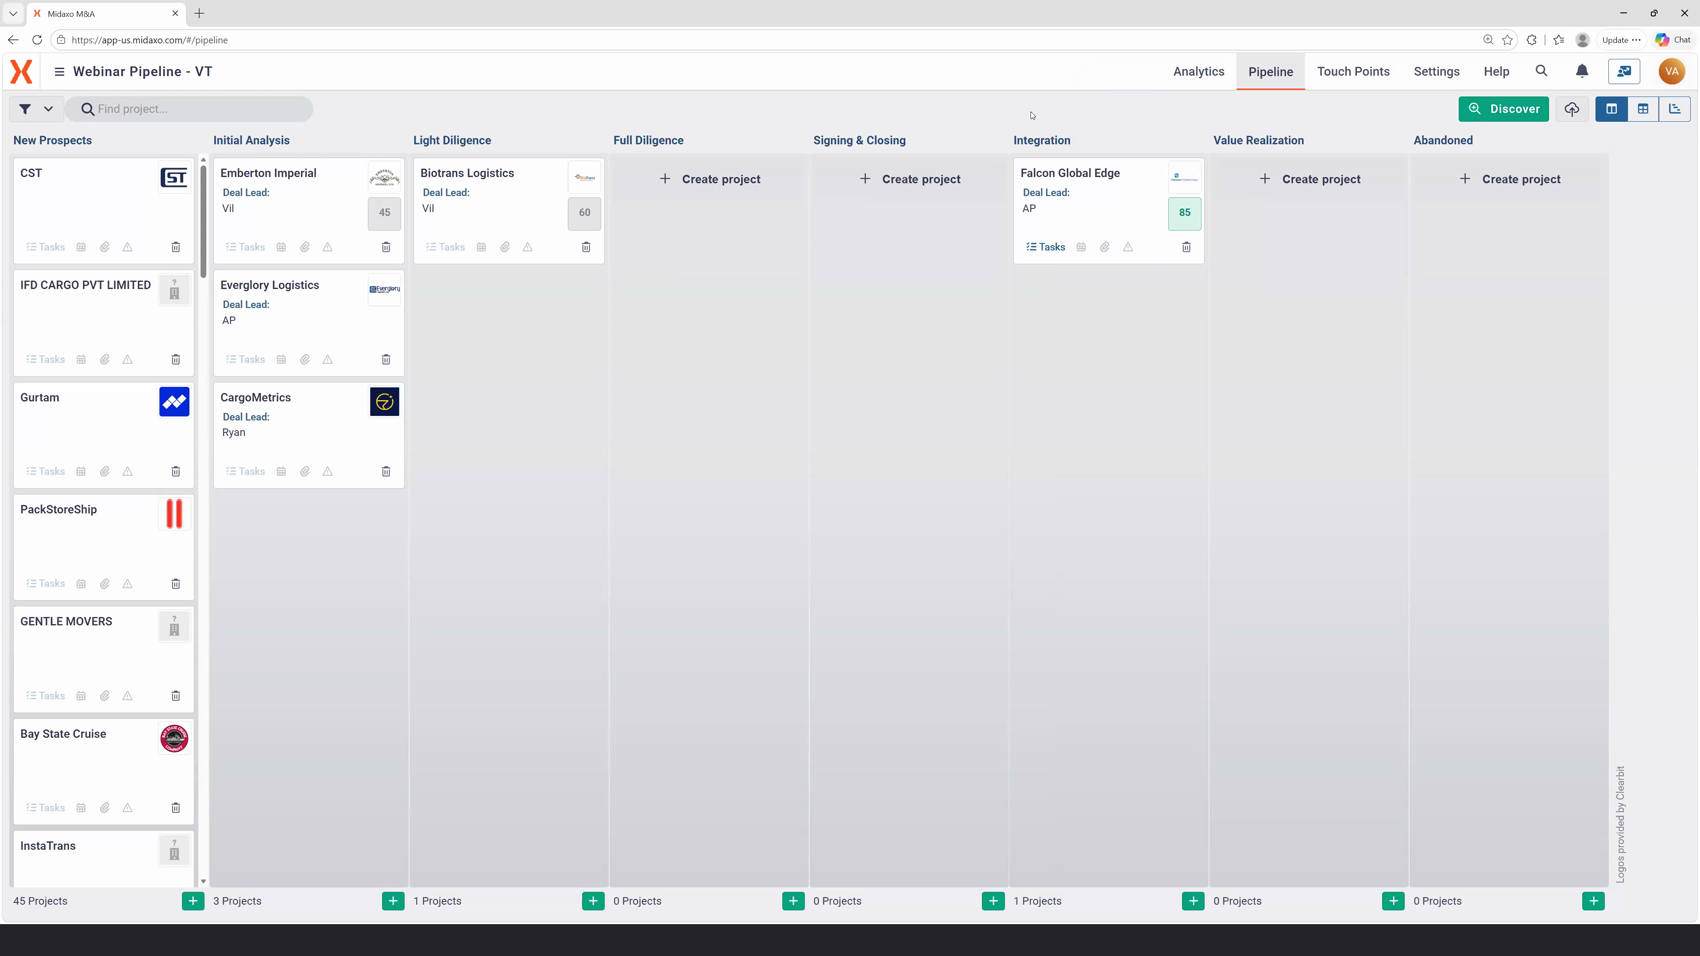
What you know.
Almost nothing. The target runs somewhere between 60 and 80 trucks. You don't know their condition, their age, or how many are surplus to the combined operation.
What you record.
Open the line item anyway:
Surplus fleet disposal · cost synergy · value: TBD · confidence: low · owner: deal lead · source: management conversation
That's it. You don't even need a number just yet. But a slot now exists, attached to this deal, that every later stage can sharpen. When diligence produces a fleet schedule, it will update a data point rather than "discovering" something.
What to watch for.
The instinct here is to wait until you have a defensible number. Resist it. A line item with "TBD" in the value field is infinitely more useful than a line item that doesn't exist, because the first one gets revisited and the second one gets invented from scratch at close, under time pressure, by someone who wasn't necessarily on the diligence call.
What you know.
The fleet schedule comes back. It's 80 trucks, and 10 of them are either out of service or uneconomic to keep maintaining. Those 10 are your disposal candidates. A quick check of comparable sales puts them around $80,000 each.
What you record.
Update the same line item, don't open a new one:
Surplus fleet disposal · cost synergy · planned value: $800,000 · confidence: medium · source: fleet schedule + market comps · assumptions: sold within 100 days of close, sold as-is
What to watch for.
Two things, and they're the ones teams so often skip.
First, write down the assumptions, not just the number. "$800,000" tells a future reader nothing. But "$800,000, assuming sale within 100 days, as-is" tells them exactly which conditions have to hold and therefore exactly what to re-check when they don't.
Second, notice that the number moved and the movement was recorded. The fleet went from "60–80, unknown" to "80, of which 10 surplus." That's diligence doing its job. If your process only captures the final number, you lose the fact that it ever changed, which is the input you need at stage 5.
What you know.
The deal closed. The integration plan is live.
What you record.
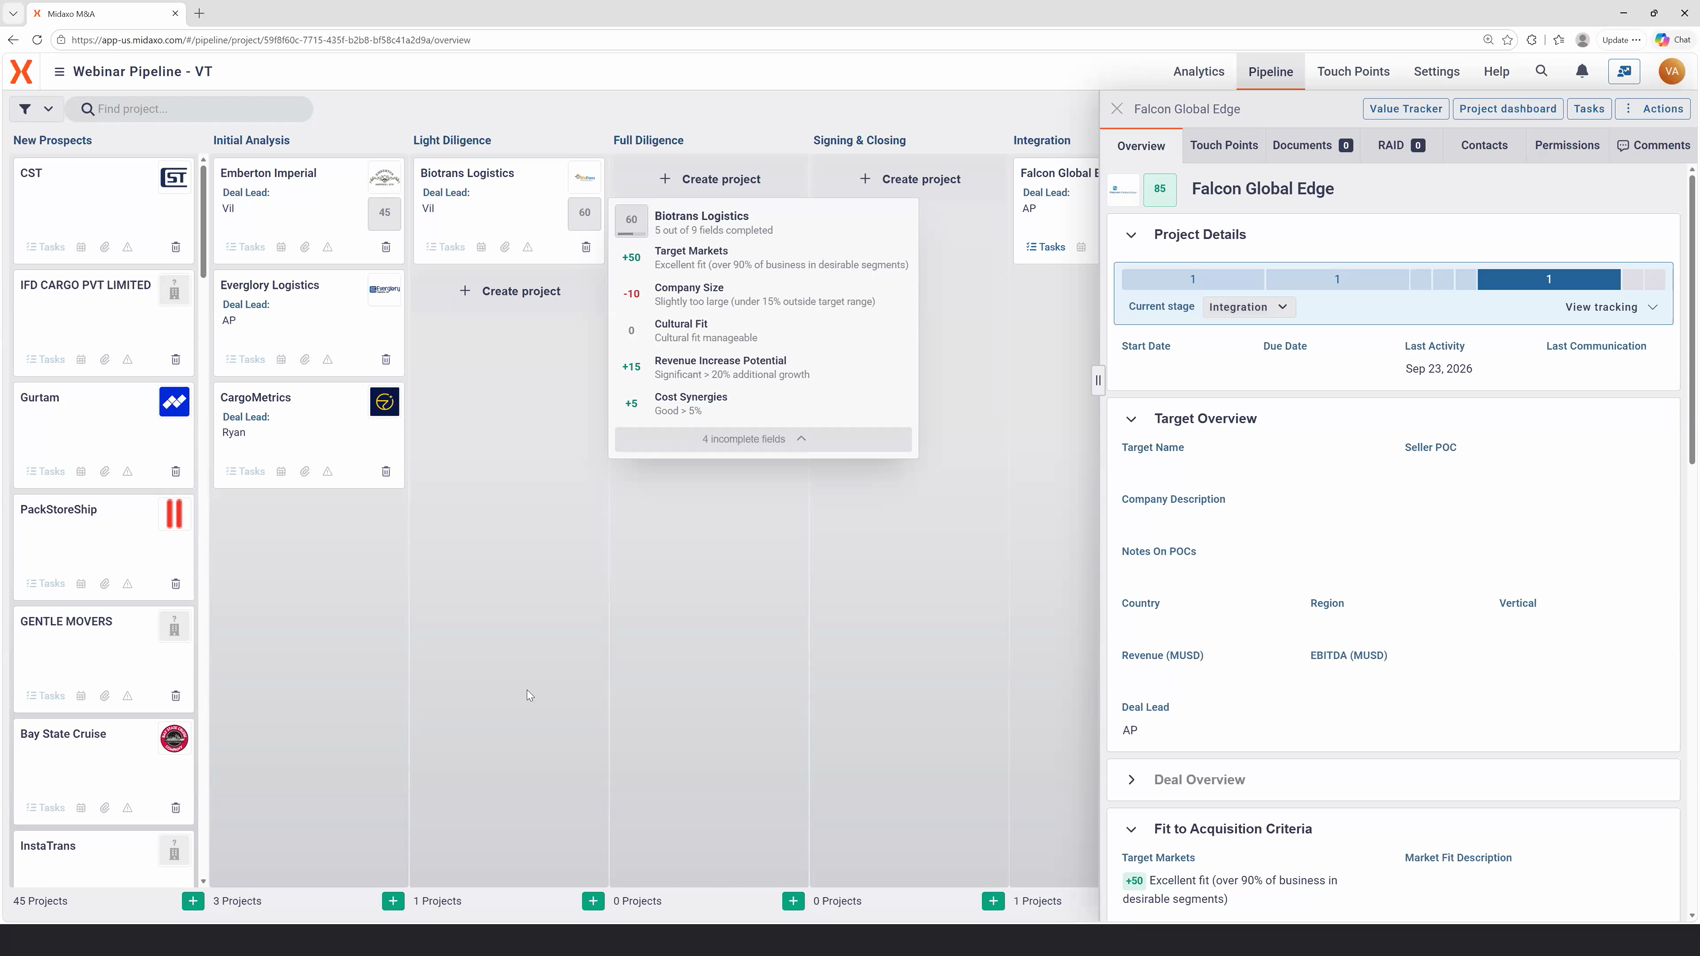
A task, linked to the line item:
Task: dispose of 10 surplus units · owner: [named person] · due: day 100 · linked synergy: surplus fleet disposal
What to watch for.
This is the stage where the most value quietly disappears, and it's worth being precise about why.
A synergy is a claim about the future. A task is a commitment by a person. If the two aren't linked, your integration checklist can show green (every listed task complete) while the synergy behind it never happens, because disposing of the trucks was never a listed task in the first place.
Test your own process this way: pick any synergy in your current plan and try to trace it to a task with a name against it. If you can't, that synergy is a forecast, not a plan.
One more thing to scope here that teams routinely miss: out-of-service vehicles usually need work before anyone will buy them. If that work isn't budgeted, your day-100 date is already fiction.
What you know.
The trucks didn't sell on day 100. They sold at month 18, for $60,000 each.
Here's where the arithmetic gets more interesting than it first appears.
The obvious number is the sale: 10 units at $60,000 is $600,000 realized against $800,000 planned, a variance of −$200,000.
But the trucks sat for eight months longer than the plan assumed, and sitting isn't free. Insurance, maintenance, and yard space on 10 idle units runs roughly $400 per unit per month. Eight months of that is $32,000 in carrying cost.
So the honest figure is:
Planned: $800,000 · Realized: $600,000 · Carrying cost: −$32,000 · Net realized: $568,000 · Variance: −$232,000 (−29%)
What to watch for.
Most trackers record the $600,000 and stop. Carrying cost is the single most commonly omitted component of a disposal synergy. If a synergy depends on getting rid of an asset, the clock starts at close, and every month of delay is a cost you should be booking against that line.
This is also why the reforecast matters as its own field, separate from plan and actual. The moment it became clear the trucks wouldn't move by day 100, the expectation changed, and recording that change at month four is what would have prompted someone to either chase the task or accept a lower price while there were still buyers.
This is the stage that pays for the other four.
You now know something specific and transferable: your fleet disposal estimates came in 25% high, and your disposal timelines came in eight months long. Don't look at that as a failure, but a calibration input. It's worth more than the $232,000 because it applies to every deal after this one.
Three concrete changes fall out of it:
If you run 20 deals a year, those three changes apply to the next 19. That's the actual return on tracking this line item, not the $232,000, which is already spent.
Here's a ten-minute version you can run this week.
Take your most recently closed deal and pick its single largest cost synergy. Then answer four questions:
If you can answer all four inside ten minutes, your tracking is in better shape than most. If you can't answer question three or if there's no record of the estimate ever moving, that's the gap worth closing first, because it will stop the next deal from inheriting what this one learned.
Here we've covered one line item. The broader question—which metrics to track across the whole deal, how to calculate them, and how long to keep reporting—is covered in our guide to the five.
If you're not tracking synergies at all yet, you're in the majority, and that gap is worth understanding before you try to close it. When you're ready to wire every synergy to a task, an owner, and a date, take a look at the platform built to help you do it.
N.B. Screenshots used in this text are from a demonstration environment built for a live webinar. All deals, companies, and figures shown are illustrative examples and do not represent real transactions or Midaxo customers.
Oct 20, 2026
•
3 minutes