Article
PMI
Post-merger integration KPIs: the 5 metrics buy-side teams should track
Track even one of these five metrics live for at least 36 months and you are ahead of the curve.
Article
PMI
Track even one of these five metrics live for at least 36 months and you are ahead of the curve.

September 29, 2026
•
5 minutes

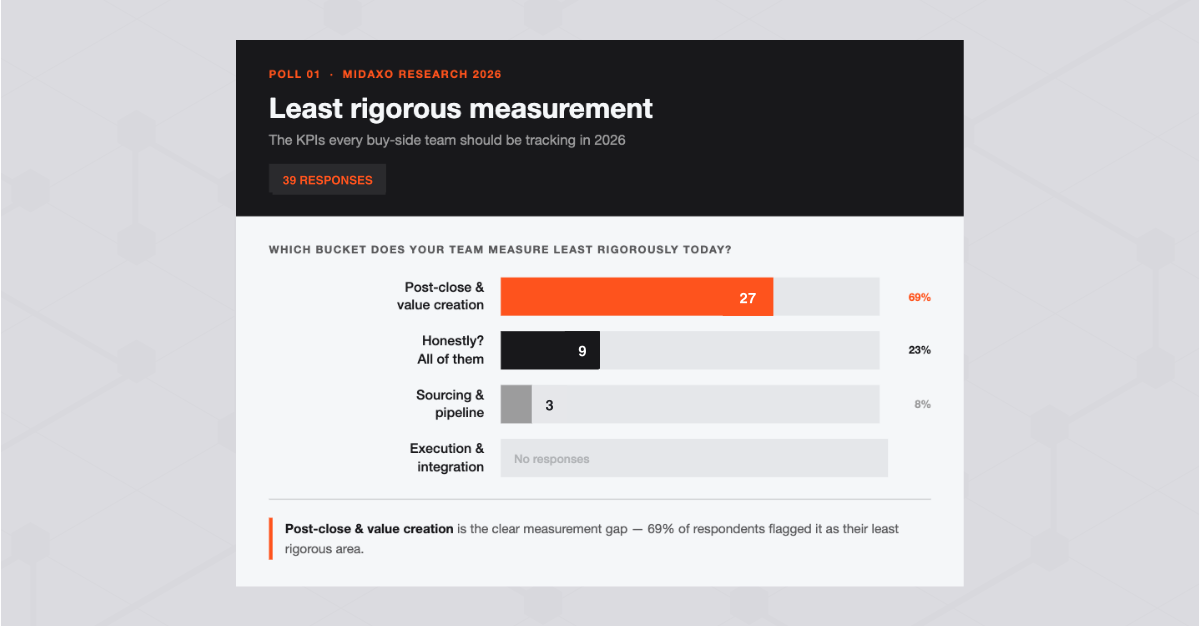
The post-merger integration KPIs that move the needle and allow acquirers to realize deal value can be boiled down to these five: synergy realization rate, deal ROI vs. ROIC, key talent retention, customer retention and NRR, and time-to-value milestones. The catch is that, in truth, very few teams are actually tracking synergies at all. Up to 60% of acquirers never run a rigorous post-close review past year one. Track even one of these five live for at least 36 months and you are ahead of the curve. Track all five and "we think the deal worked" turns into something you can prove with data.
When we look at how buy-side teams measure integration, the breakdowns almost always fall into three patterns. Before we get to the five KPIs, it's worth naming them, because the best metric in the world won't help if it's sitting inside one of these traps.
The five KPIs below are designed around all three. These are metrics that drive a decision rather than decorating a slide, metrics that someone owns end to end, and metrics that keep getting measured long after the deal closes.
Here's the reference view first: what each KPI is, how it's calculated, what "good" looks like, and when to measure it, followed by some detail for each.
1. Synergy realization rate. This is a headline number: realized synergy value divided by planned synergy value, tracked separately for cost and revenue. Reporting them together is one of the easiest ways to muddy the signal, because cost synergies tend to land earlier and more predictably, while revenue synergies depend on customer behavior and sales motion and are far harder to forecast. Split them to get a much cleaner read on where your progress stands.
2. Deal ROI vs. ROIC. ROI tells you whether a single deal paid back against what you put in. Return on invested capital tells you whether the deal is earning above your cost of capital once you've folded in the integration spend, the working capital, and the assets you inherited. A deal can post a flattering ROI and still destroy value on an ROIC basis, which is the kind of thing that stays hidden if you only ever look at one or the other.
3. Key talent retention. The people who make the thesis work are usually a short list, and losing them is often the first synergy to evaporate. Track retention of the named individuals you flagged in diligence. Blended headcount hides the departures that matter behind a general number.
4. Customer retention and NRR. For any deal where revenue is part of the thesis, net revenue retention captures churn, contraction, and expansion in one number, and it's where an over-optimistic revenue synergy assumption often shows up first.
5. Time-to-value milestones. After close, there's a window in which value is supposed to be realized, and the longer that window stretches, the less likely you are to capture it. This KPI ties everything else back most obviously to your integration plan: each synergy needs a task, an owner, and a date, or it simply doesn't happen.
Tying synergies to the rest of your plan seems obvious, but it is so important, it deserves its own section.
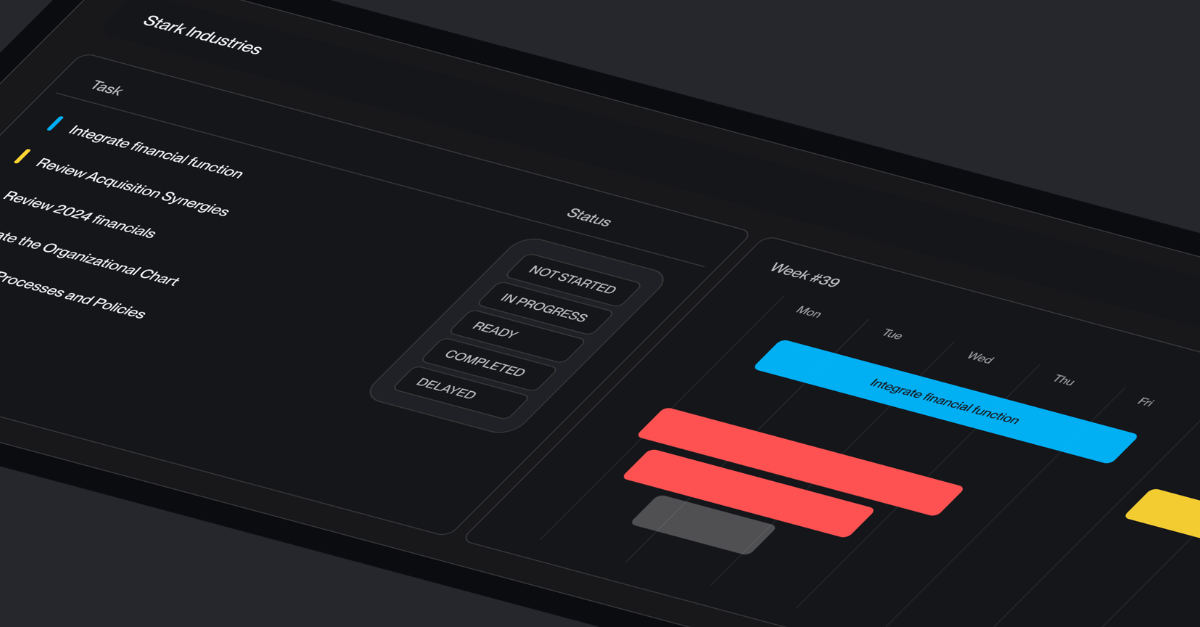
A synergy that isn't attached to a task with an owner and a date is essentially useless. Take the classic example: you plan to sell off surplus equipment after close, but no one is assigned to actually sell it. Now it sits there taking up space, drawing insurance and maintenance, and a line item that was supposed to generate value starts costing you money instead.
Plotting realized value against your implementation plan over time will make the drift visible before it compounds. The gap between the curve you planned and the curve you're actually on is your value at risk, which is a number you can act on while there's still time to act.
The reason to report this live for at least 36 months rather than closing the book at year one is simple: the first anniversary is only the beginning of synergy realization. Some acquirers track value for five, seven, even ten years, not expecting full realization until year six or seven. Whatever your horizon, the discipline is the same: keep the plan and the actuals side by side so you can keep adjusting as necessary.
There's a temptation to avoid revising a forecast downward, to not write down that the 80 trucks you modeled, for instance, turned out to be 60 once diligence and the market had their say. But revision is crucial, and kind of the whole point. An acquirer running a busy pipeline makes the same class of estimate on every deal. If you catch and own an overestimate once, the next deals in the pipeline will be calibrated against reality instead of repeating the mistake. Across a highly acquisitive program, that compounding intel is worth far more than a single deal's tidy-looking scorecard.
We walked through exactly how this plays out—one assumption, tracked versus untracked, and what it costs across a 20-deal-a-year pipeline—in a short worked example. Check it out here if you're interested.
What are the most important KPIs for post-merger integration?
The five that consistently matter for buy-side value realization are synergy realization rate (split into cost and revenue), deal ROI vs. ROIC, key talent retention, customer retention and NRR, and time-to-value milestones. Your strategy, deal complexity, verticals, and geographies will shift which one leads, but this set is a solid starting point for almost any acquirer.
How long should you track integration KPIs after close?
At least 36 months. The first anniversary is the start of synergy realization, not the finish. Some acquirers — particularly those with long-horizon theses — track value for up to a decade. One-time synergies can drop off the report once realized; everything ongoing should stay under review quarterly or monthly.
What's the difference between deal ROI and ROIC?
ROI measures the return on what you invested in a single deal. ROIC measures whether the deal earns above your cost of capital once integration costs, working capital, and inherited assets are included. A deal can look good on ROI and still underperform on ROIC, which is why serious acquirers track both.
Why separate cost synergies from revenue synergies?
Because they behave differently. Cost synergies generally realize earlier and are easier to forecast; revenue synergies depend on customer behavior and sales motion and carry far more uncertainty. Reporting them as one number hides which half of your thesis is actually on track.
Do you need special software to track PMI KPIs?
No, you can start today in a spreadsheet, and doing so beats not tracking at all. The risk is that spreadsheets and siloed tools get hard to sustain across deal velocity and lose context between stages, which is where a purpose-built M&A platform earns its keep. The metrics matter more than the tool; the tool matters for keeping them alive over 36 months and many deals.
If you can name these KPIs but aren't yet tracking them live from pipeline through year three, that's a gap worth closing. It starts with wiring each synergy to a task, an owner, and a date. See how Midaxo connects your deal thesis to realized value across the whole pipeline: explore the Midaxo platform, or read how our customers track value post-close.
Oct 20, 2026
•
5 minutes